P hat is a key tool in data analysis and research. It helps estimate the proper proportion of a population.
This tool is helpful for market research and studying consumer behavior. P that can provide valuable insights for various studies.
We’ll explore p hat’s importance and how to calculate it. You’ll learn how to use it in different fields.
This guide will help you understand this statistical concept. You’ll see how it can make your research more reliable.
A vibrant and colorful abstract representation of statistical sampling, featuring various geometric shapes like circles, squares, and triangles scattered across a background that symbolizes a graph or chart; incorporate elements like dots and lines connecting the shapes to represent data points and proportions, with a harmonious blend of colors to illustrate diversity in sampling methods.
Understanding P Hat and Its Importance
P hat (p̂) is a key concept in statistical analysis. It’s a point estimate that shows the proportion of a population with a specific trait.
P hat helps researchers conclude large populations from sample data. It provides a numerical representation of the actual population proportion.
Researchers use p hat to estimate the likelihood of specific outcomes in populations. This is valuable in market research, social sciences, and medical studies.
P hat is linked to confidence intervals in statistics. These intervals show the range where the proper population proportion likely falls.
Understanding p hat is crucial for making informed decisions based on sample data. It helps researchers gain insights into population characteristics and trends.
How to Calculate P Hat
P hat is a key metric in statistical analyses. It helps measure success rates in a sample.
The formula for p hat is simple: ̂p = x/n. X is the number of successes. N is the total sample size.
The sample size is crucial when calculating p hat. Larger samples often give more accurate estimates.
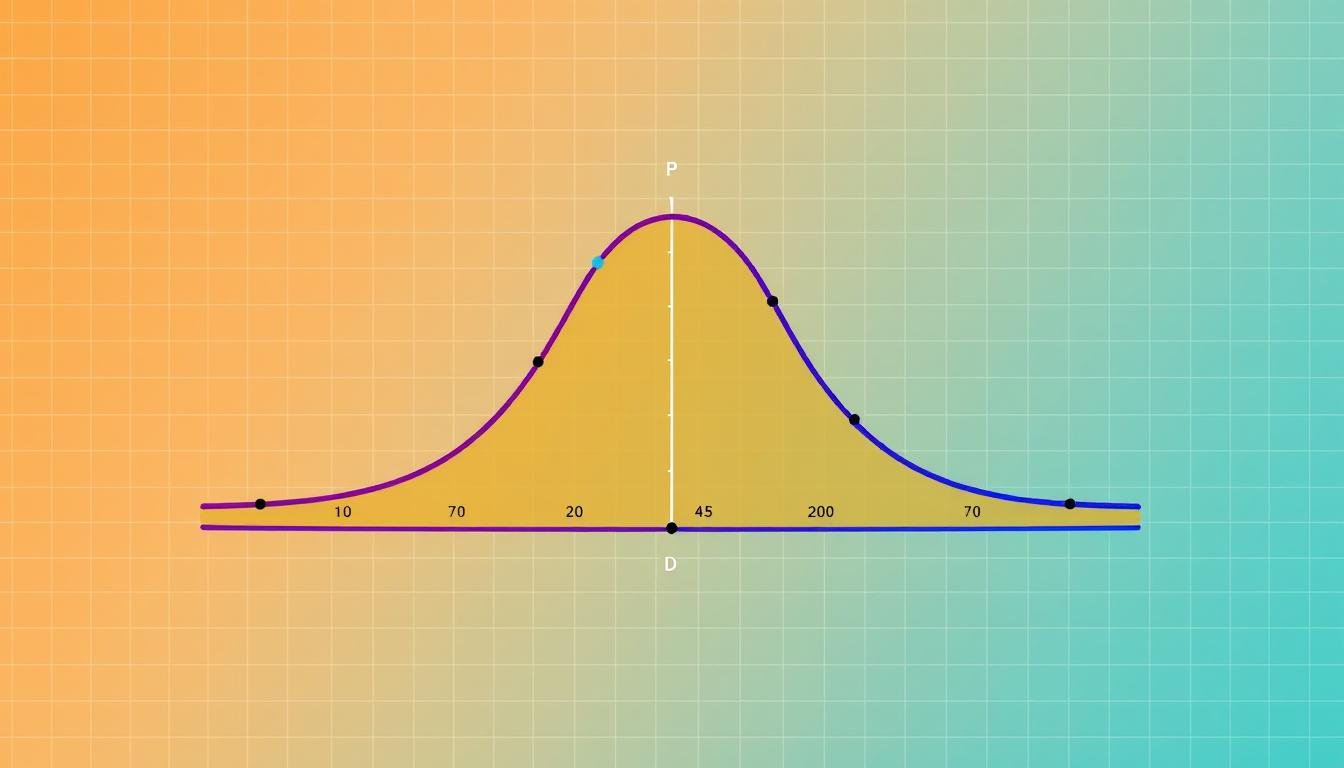
The binomial distribution is essential for understanding p hat. It shows the chances of success in fixed trials.
A visually engaging representation of a binomial distribution curve showcasing a smooth, bell-shaped graph with distinct sections illustrating different probabilities. Include plotted data points along the curve, each marked clearly, with contrasting colors for visual clarity. The background should have a subtle grid pattern to enhance the statistical theme, with vibrant colors to make the graph stand out while maintaining a professional look.
P hat uses a simple formula. However, its use needs a profound grasp of sampling and statistics.
Mastering p hat helps researchers draw insights from data and make well-informed choices in their work.
Applications of P Hat in Research
P hat is a key statistical concept. It has many uses in different research areas.
One primary use is in hypothesis testing. P hat helps researchers check if their findings are significant.
It’s also valuable for survey analysis. P hat can estimate how many people have a particular trait.
This helps understand market trends and consumer likes.
P hat is also used in quality control. It can track the number of faulty products made.
P hat is a versatile tool for researchers. It helps them draw accurate conclusions from their data.
By knowing how to use p hat, researchers can improve their work.
Common Misconceptions About P Hat
P hat is a statistical proportion sampling metric. Many people need to understand this critical concept.
P hat doesn’t directly measure statistical significance. It provides insights into the likelihood of observing outcomes.
Statistical significance involves the entire distribution of possible outcomes. It’s not determined by p hat alone.
P hat doesn’t always relate to confidence levels. Confidence levels depend on the whole sampling distribution.
P hat isn’t immune to sampling bias. Its accuracy relies on the sample’s quality and representativeness.
A biased sample can lead to a skewed p hat. This can result in incorrect conclusions.
Understanding these misconceptions helps interpret p hat accurately. It allows for meaningful insights from your data.
Best Practices for Using P Hat
P hat is a key statistical measure. To use it well, follow some essential steps.
Choose a fair sample for your research. Use random selection to get good data.
Pick the right software for accurate p hat math. SAS, SPSS, or R are great choices.
Think about what your p hat results mean. Consider the limits of your findings.
These steps help you use p hat correctly. You’ll get better insights for your work.
P that can help in many fields. It’s useful for market research and policy studies.
FAQ
What is p hat in statistical sampling?
P hat (p̂) is the sample proportion. It estimates the proper population proportion through statistical sampling and analysis.
This statistic provides insights into population characteristics based on a sample.
Why is p hat important in research and data analysis?
P hat helps researchers make inferences about population parameters. It’s used to estimate proportions, test hypotheses, and calculate margins of error.
How is p hat calculated?
The formula for p hat is p̂ = x / n, where X is the number of successes in the sample.
N is the total sample size. This calculation estimates the population proportion.
What are some real-world applications of p hat?
P hat is used in market research, political polling, and quality control. It helps estimate preferences, predict elections, and monitor product quality.
What are common misconceptions about p hat?
People often think p that is the exact population proportion. Some assume it’s always statistically significant.
Others need to consider sampling bias and other limitations.
What are the best practices for using p hat effectively?
Design a representative sample and use suitable data collection methods. Use proper software for calculations and interpret results carefully.
Consider margins of error and confidence intervals when using p hat.
you may also read : Discover Latest News & Updates on Bladi Net Today

